Robin Skånberg, Scientific Visualization Group, Linköping University
Martin Falk*, Scientific Visualization Group, Linköping University
Mathieu Linares, Scientific Visualization Group and Laborartory of Organic Electronics, Linköping University
Anders Ynnerman, Scientific Visualization Group, Linköping University
Ingrid Hotz, Scientific Visualization Group, Linköping University
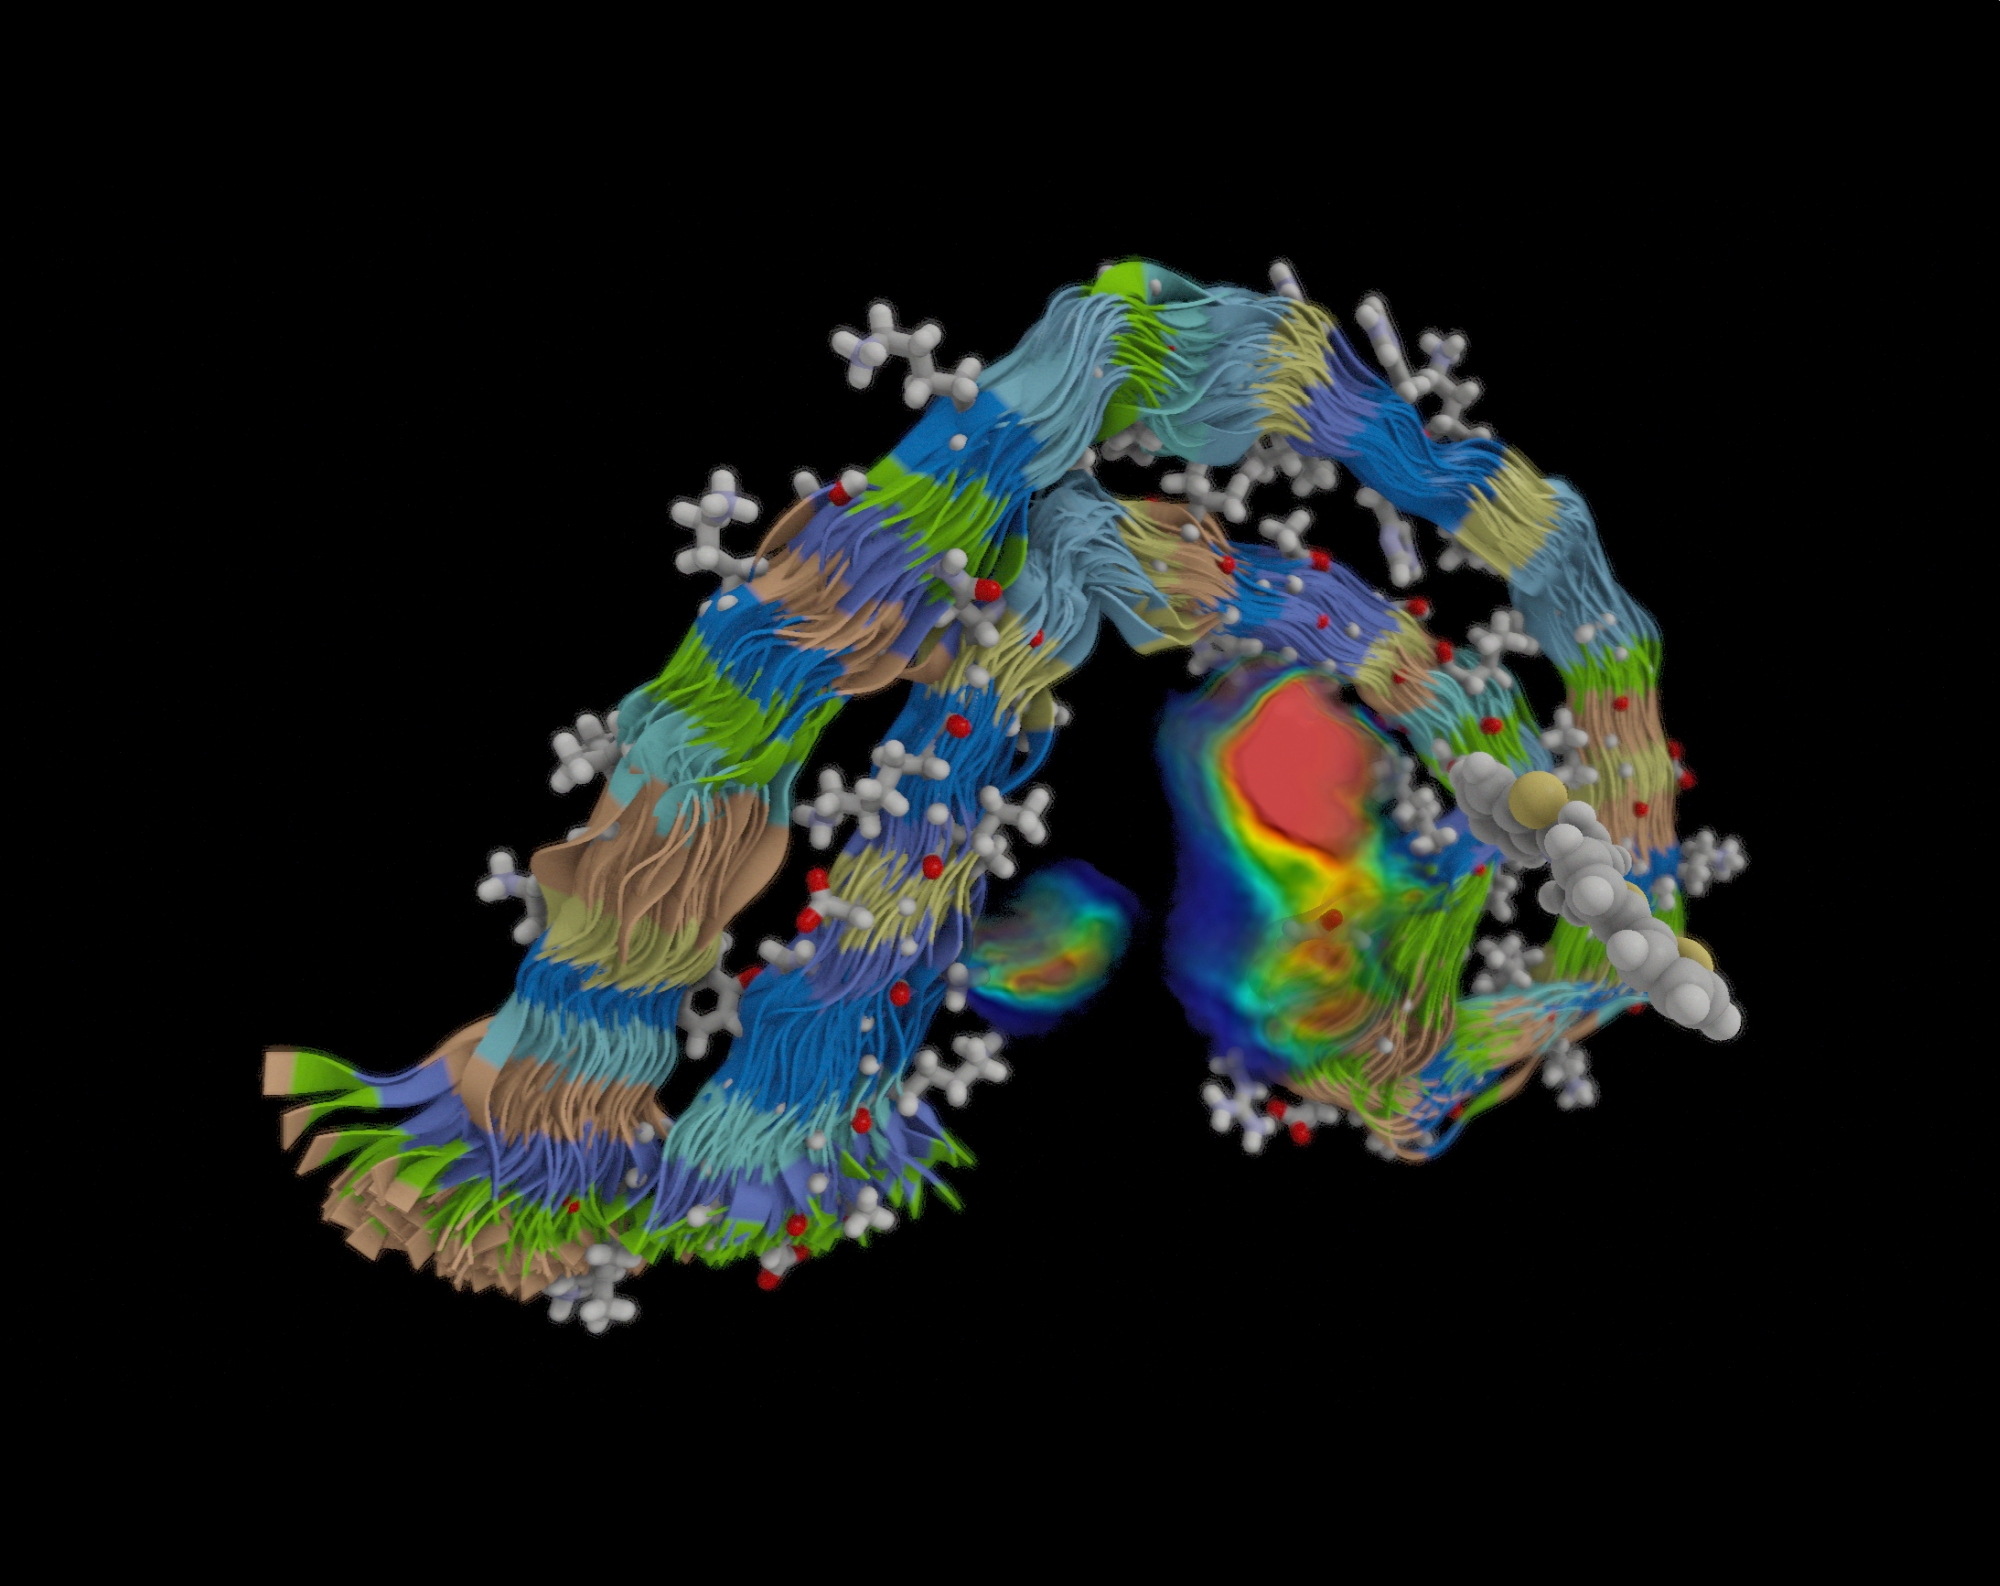
Superposition of 370 amyloid fibril chains onto a single structure obtained by tracking the internal frames of reference (backbone: ribbon structures; side chains: licorice). Luminescent biomarkers (van der Waals representation) near the fibrils identify specific protein misfold characteristic of Alzheimer’s disease. Aggregating the biomarkers over time and space results in spatial distribution functions (volume rendering) revealing a specific binding site.